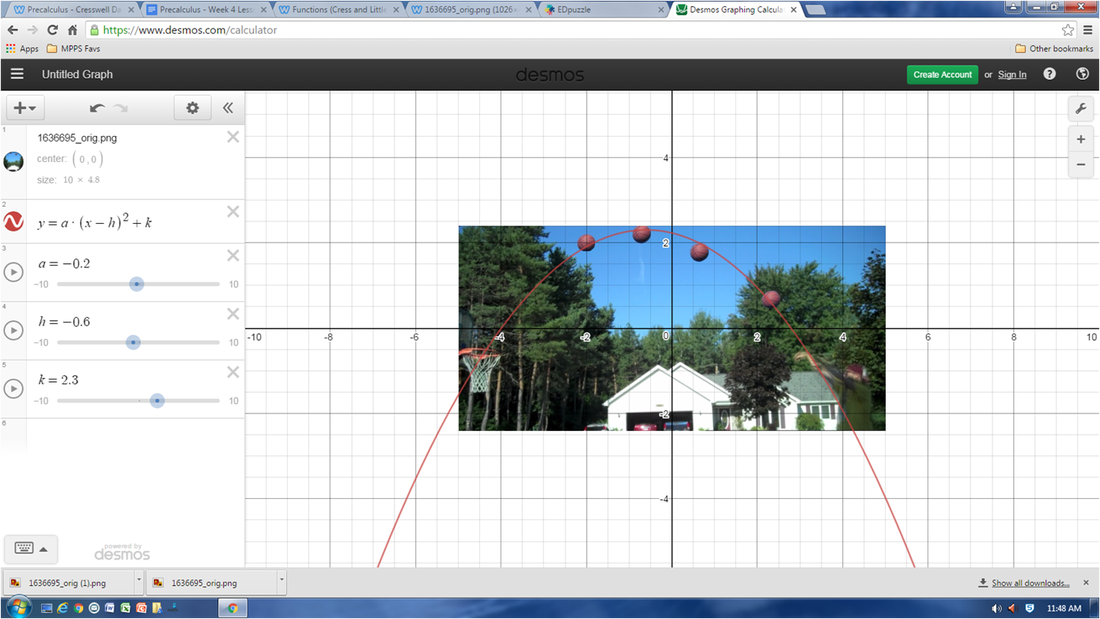
 I believe the ball is going to swish in according to the parabola i have found of the ball.
0 Comments
(1)The function of the graph is an exponential function. 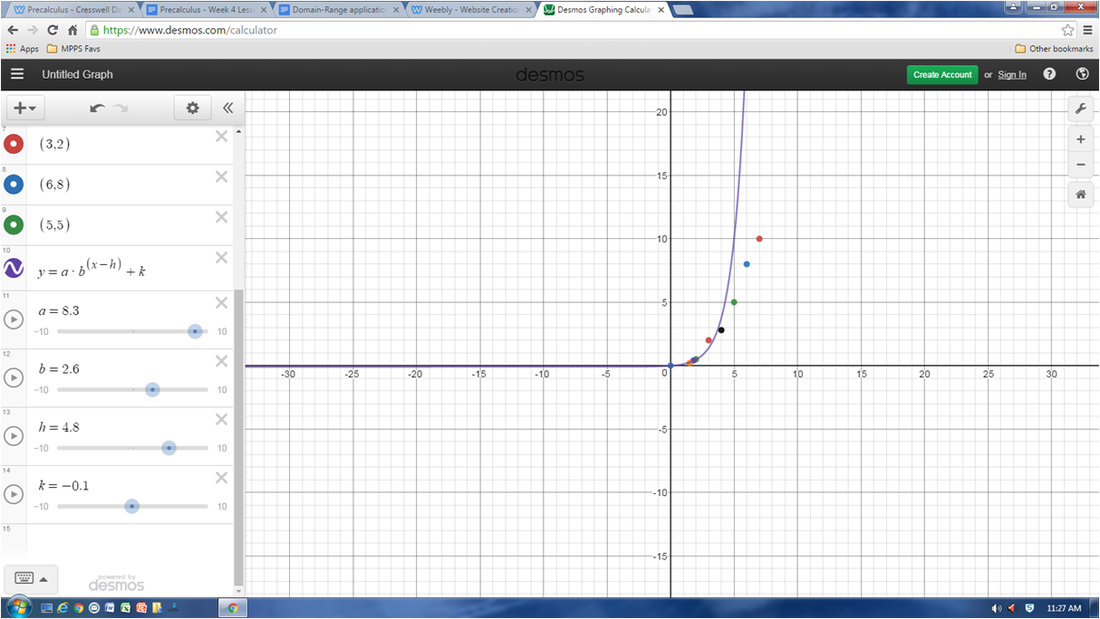 (2) I used the equation y=a x b^(x-h)+k (3)The domain is everything above zero (4)The range is everything above zero  Graph A shows that the scout steadily continues up the flag pole at the same pace all the way up.
Graph B shows the scout going up the pole extremely fast at the beginning and slowly down significantly towards the end. Graph C shows the scout alternating between going slightly faster or slightly slower up the flag pole. Graph D shows the scout starting of fairly slow yet the closer he got to the end the faster he went up the flag pole. Graph E shows the scout starting off slow at the beginning, going very fast towards the middle, and slowing back down once he reached near the end of the pole. Graph F shows the scout waiting a little bit before shooting straight up to the top of the pole. Graph B shows the most realistic situation because at the beginning the scout would try to go as fast as possible before eventually getting tired and slowly moving up the pole at a slower pace. Graph F shows the most unrealistic situation because the scout goes from the bottom to the top of the pole immediately, taking up no time to get to the top of the pole. |
AuthorWrite something about yourself. No need to be fancy, just an overview. Archives
December 2016
Categories |
 RSS Feed
